
The Wedge Pattern is a handy tool for traders to predict potential price reversals. This pattern comes in two forms: the rising wedge and the falling wedge, each with its definitive signals.
Today, we will take a closer look at these candlestick patterns, discover how they may be used, and learn about the risk management techniques that need to be applied.
- What is a wedge pattern?
- Rising wedge pattern explanation
- How to spot the rising wedge pattern
- Falling wedge pattern explanation
- How to spot the falling wedge pattern
- Setting a stop-loss
- Is the wedge pattern bullish or bearish?
What is a Wedge Pattern?
The first point to understand is what the wedge pattern represents. The wedge pattern is a technical analysis formation characterized by converging trend lines on a price chart. These trend lines typically slope either upwards or downwards, forming a triangular shape resembling a wedge.
The pattern emerges as the highs and lows of the price action oscillate within a narrowing range, suggesting a gradual loss of momentum in the prevailing trend. Technical analysts consider the converging trend lines a strong indicator of a potential reversal in the asset price.
☝️
- Wedge patterns are formations that are usually characterized by converging trend lines over 10 to 50 trading periods
- There are ascending and descending wedge patterns
- A decline in trading volume is often observed as the price progresses within the wedge pattern
Rising Wedge Pattern
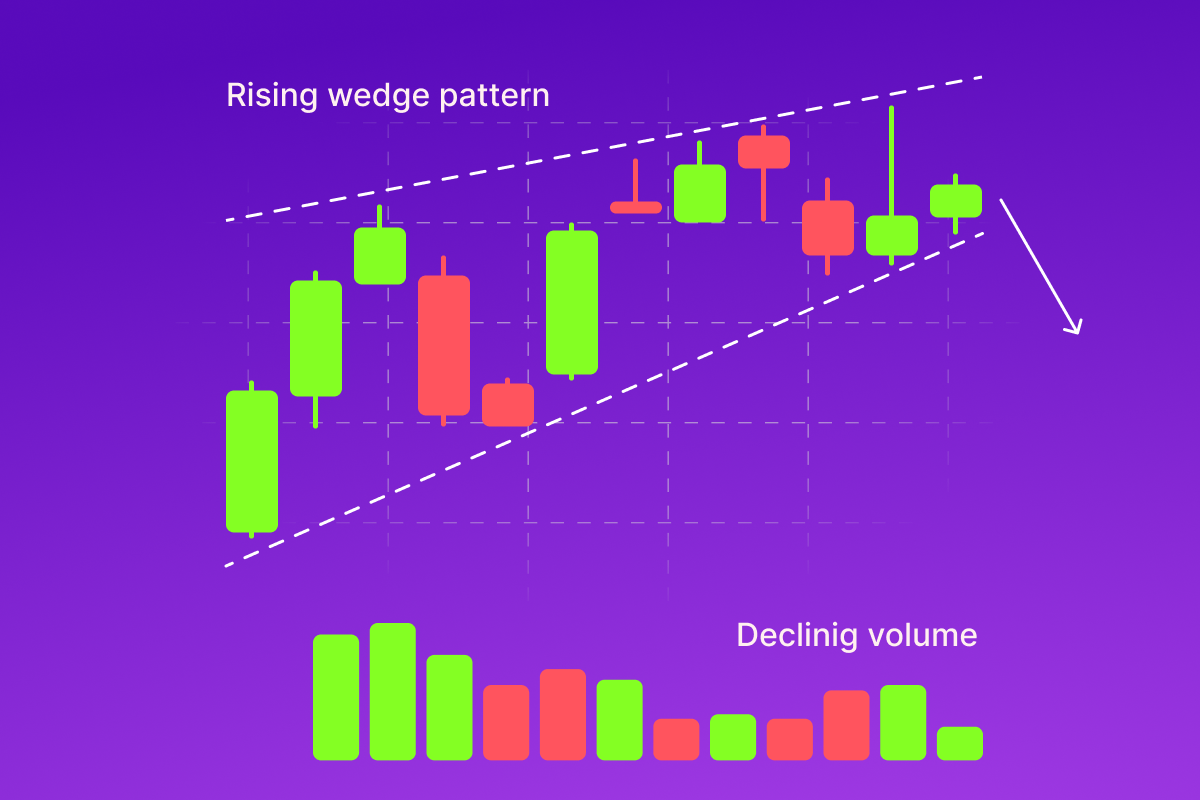
A rising wedge pattern, sometimes called an ascending wedge, is a pattern that can help predict a bearish reversal. An ascending wedge is formed when the price is climbing upward with higher highs and higher lows. The price, if enclosed with trend lines, forms a narrowing corridor pointing upwards. As the price nears the apex, it tends to reverse direction and break below the support trend line. It signals the change in power between the buyers and sellers, with the buyers losing the upper hand.
☝️
It is important to wait for the first candle to close below the support line after the price breaks through. While the ascending wedge pattern is an effective indicator, sometimes the price can bounce upwards after the brief reverse. Waiting for the confirmation is recommended to avoid false signals.
How to Spot a Rising Wedge Pattern?
When looking for a rising wedge pattern, make sure that it meets the following conditions:
- The price is in an upward trend, with the candlesticks forming higher highs and higher lows;
- When the highs and the lows are respectively connected with trend lines, they are bound to converge as the price continues to rise;
- The trading volume for the asset tends to decline when the price is about to reverse;
- The pattern is confirmed when the price breaks below the lower trend line, continuing in a bearish trend.
Note that while the ascending wedge is a bearish signal, it can occur both during an uptrend or downtrend.

Falling Wedge Pattern
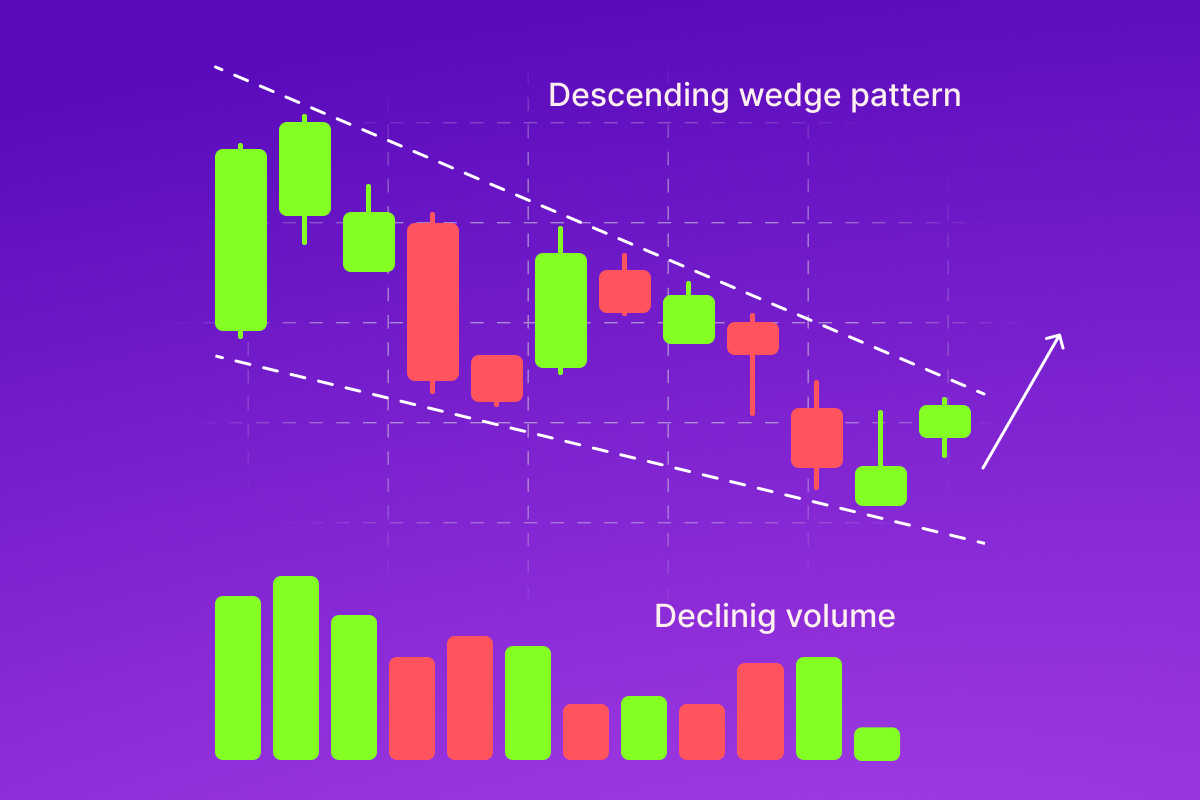
On the flip side, the falling or descending wedge pattern is a formation that slopes downwards. As the price drops, sellers begin to lose steam. The buyers gradually step in, causing the price decline to slow down, and, finally, reverse. The descending wedge pattern helps to predict a bullish reversal. The pattern is formed with lower highs and lower lows, which form converging trend lines when connected respectively.
☝️
Considered a very reliable indicator, the falling wedge is confirmed with the first green candlestick that closes above the upper trend line.
How to Spot a Falling Wedge Pattern?
To find the descending wedge on a price chart, look for the following characteristics:
- The price is in a downward trend, with the candlesticks forming lower highs and lower lows;
- Connecting the highs and the lows with trend lines respectively shows a narrowing wedge, pointing downward;
- The trading volume is declining;
- The pattern is confirmed when the price reverses and breaks through the upper trend line (resistance line), continuing in a bullish trend.
Setting a Stop-Loss
As with any trading strategy, trading with wedges requires implementing risk management tools. Setting a stop-loss is an important part of any reversal strategy, as it allows traders to bring the potential loss to a minimum.
Since wedges form tight price corridors, the distance between the entry price and the price for the stop loss is relatively small. This allows traders to set a stop loss very close to the entry price at the beginning of the trade, and receive greater outcomes than the amount risked on the trade.
Is the Wedge Pattern Bullish or Bearish?
- A rising wedge pattern is considered to be bearish because it signals the moment when the price stops climbing up and reverses into a downward trend.
- The falling wedge pattern is bullish since it illustrates the market’s reversal into an ascending trend.
Conclusion
Understanding how to spot the wedge pattern and correctly interpret its signals can be a highly effective tool for traders who want to trade price reversals. Remembering the characteristics of the rising and falling wedges may allow traders to timely take advantage of emerging opportunities in the market.
While wedges are largely considered to be useful and reliable indicators, their signals require confirmation and the usage of careful risk management. Continuous practice and consistency are key to mastering the art of trading with the wedge pattern.

