
Using strategies for predicting price movements in binary options can be tricky due to their fast-paced nature. However, this is just a challenge, not a dead end! With the right strategy, you can boost your win rate and earn on binary options like a money-making machine. Here are the five best binary options strategies to use on IQ Option. Let’s go!
1. Five candles: basic no-indicator Binary Options strategy
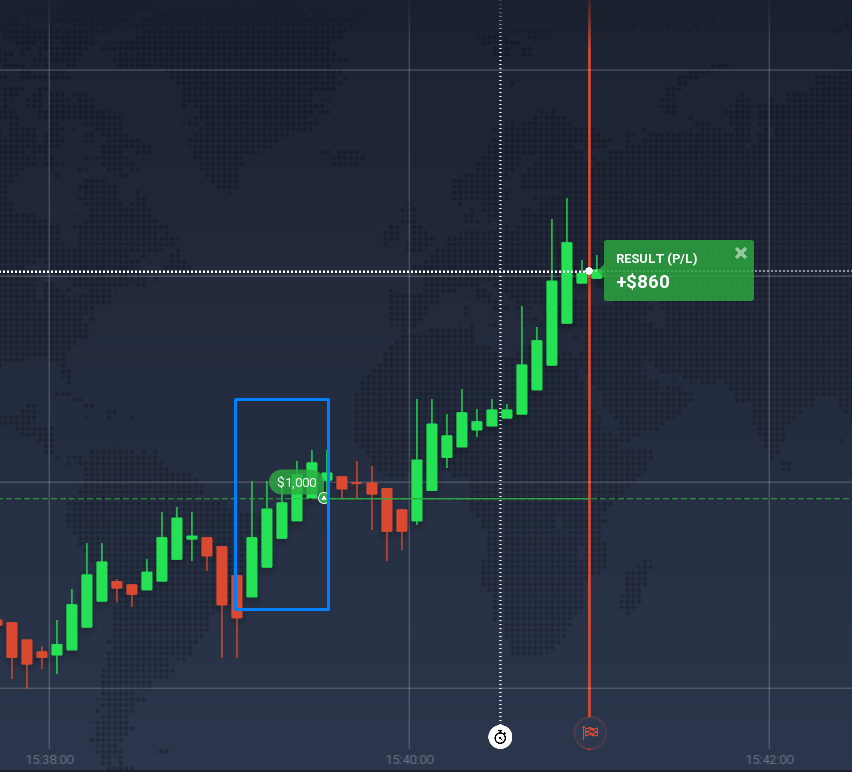
Let’s start simple. Sequential candles of the same color are a widely used method for finding entry points and recognizing trends and pullbacks.
How to use:
- Switch the candle type to Heikin-Ashi.
- Search for five consecutive candles of the same color. This indicates that the trend will most likely continue.
☝️
Pay attention to candle quality. If you spot dojis (resembling a cross) or spinning tops (candles with long shadows and a small body compared to the shadows), these indicate that the sequence is likely to break soon.
- Enter a trade at the close of the 5th candle, in the direction of these candles.
2. Bollinger Bands: easy single-indicator strategy
An easy method for choosing an entry point and direction is by using the Bollinger Bands indicator. Here’s how it works:
- Apply the Bollinger Bands indicator with the following settings:
- Period: 20
- Deviation: 2.5
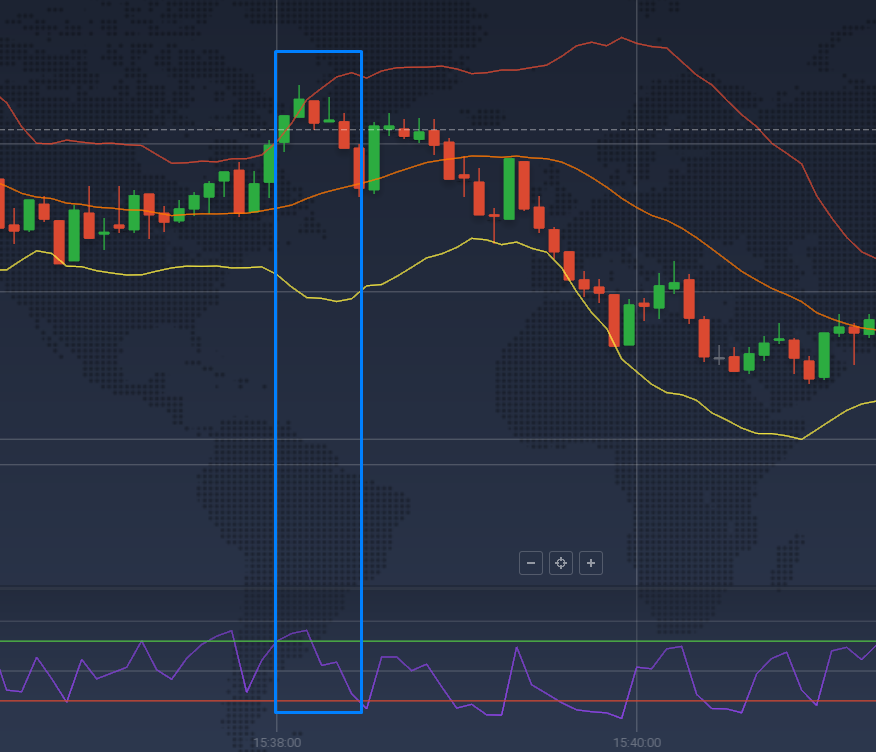
- Wait for the candle to close beyond the upper or the lower line — the farther, the better.
- Enter the trade on the second candle moving in the opposite direction when it crosses the line.
For example, the image below demonstrates a large red candlestick breaking through the lower Bollinger line, followed by a green one. In this scenario, you’re advised to open a trade in the direction of the latter, i.e., bullish.
- If a red candle breaks below the lower line and is followed by a green candle, enter a CALL trade.
- If a green candle breaks above the upper line and is followed by a red candle, it’s a good moment for a PUT trade.
💡 Tip: feel free to use RSI with base line of 4 and overbought/oversold levels set at 80 and 20 for confirmation.
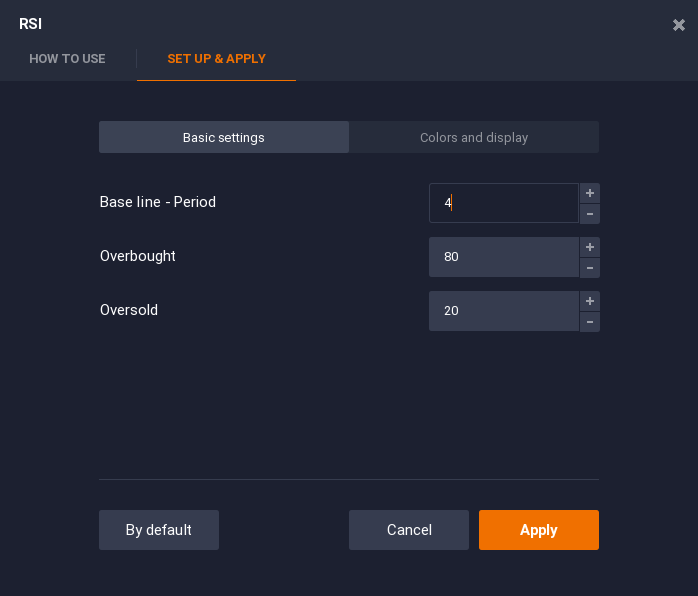
The RSI is a line that fluctuates within the range of 0 to 100 and indicates overbought and oversold conditions, potentially signaling a trend reversal. RSI is considered overbought when above 70% and oversold when below 30%.
- If the indicator crosses the upper level, it suggests that the price is rising too fast and is expected to decline soon. This would be your bearish signal.
- When the indicator crosses the lower line, it indicates that price is falling too quickly and is likely to start rising, hinting at a bullish trade.
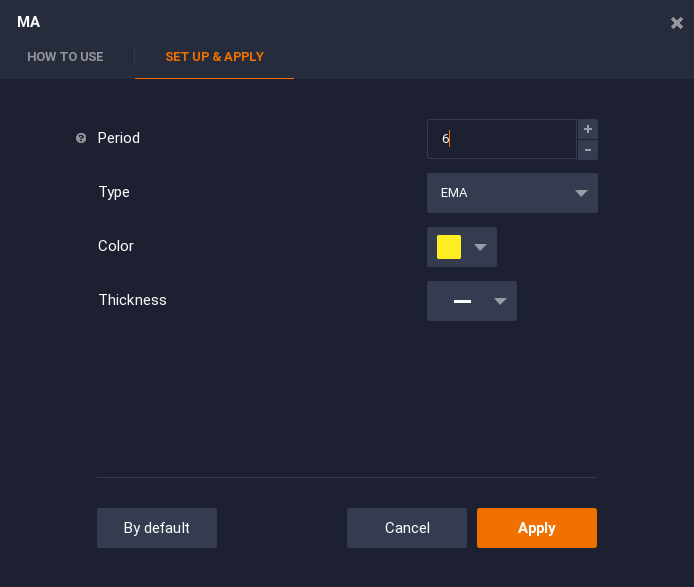
3. EMA + Doji + Heikin-Ashi
This strategy utilizes just one indicator — EMA — along with switching the chart type to Heikin-Ashi candlesticks. Heikin-Ashi is a combo of candlesticks and a technical analysis indicator. Unlike “normal” candlesticks that provide straightforward information about price action for a given time period, Heikin-Ashi candlesticks offer a modified view of price action that helps identify trends and filter out some of the market noise.
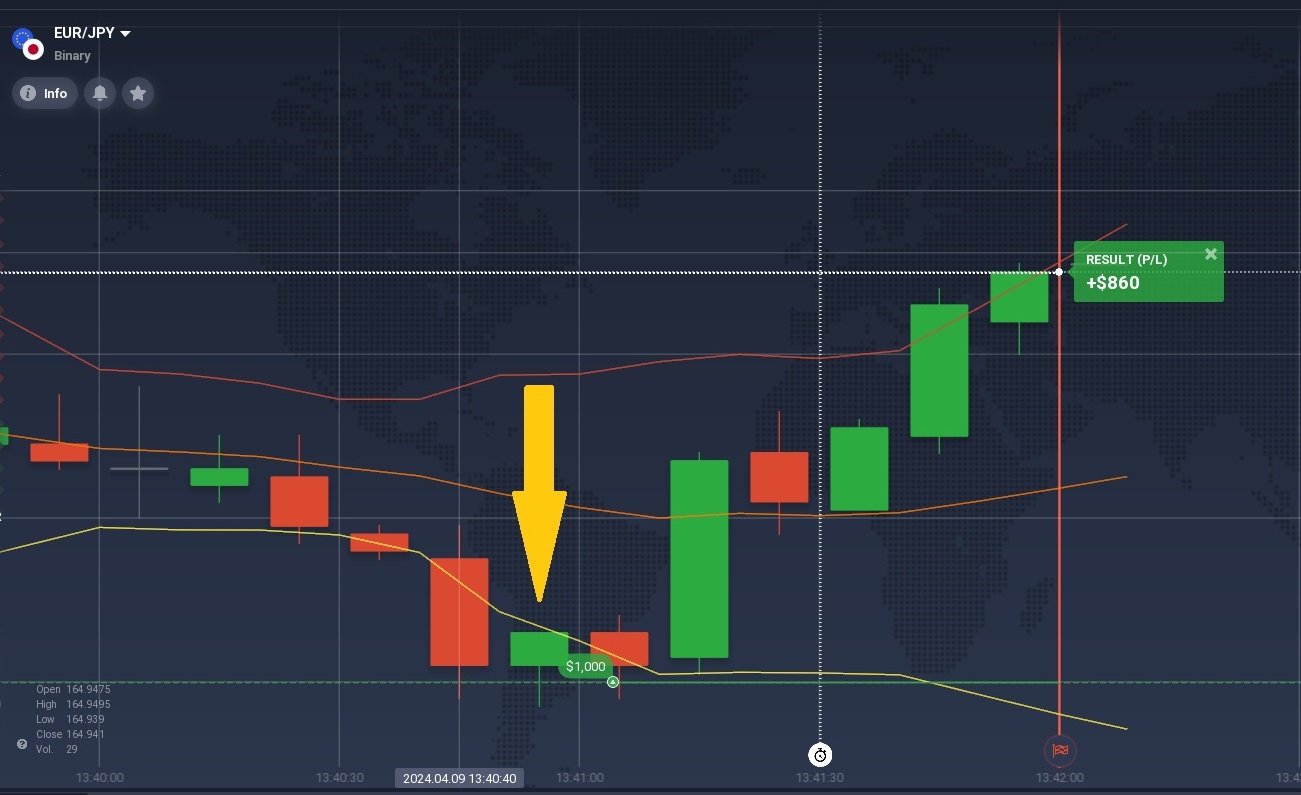
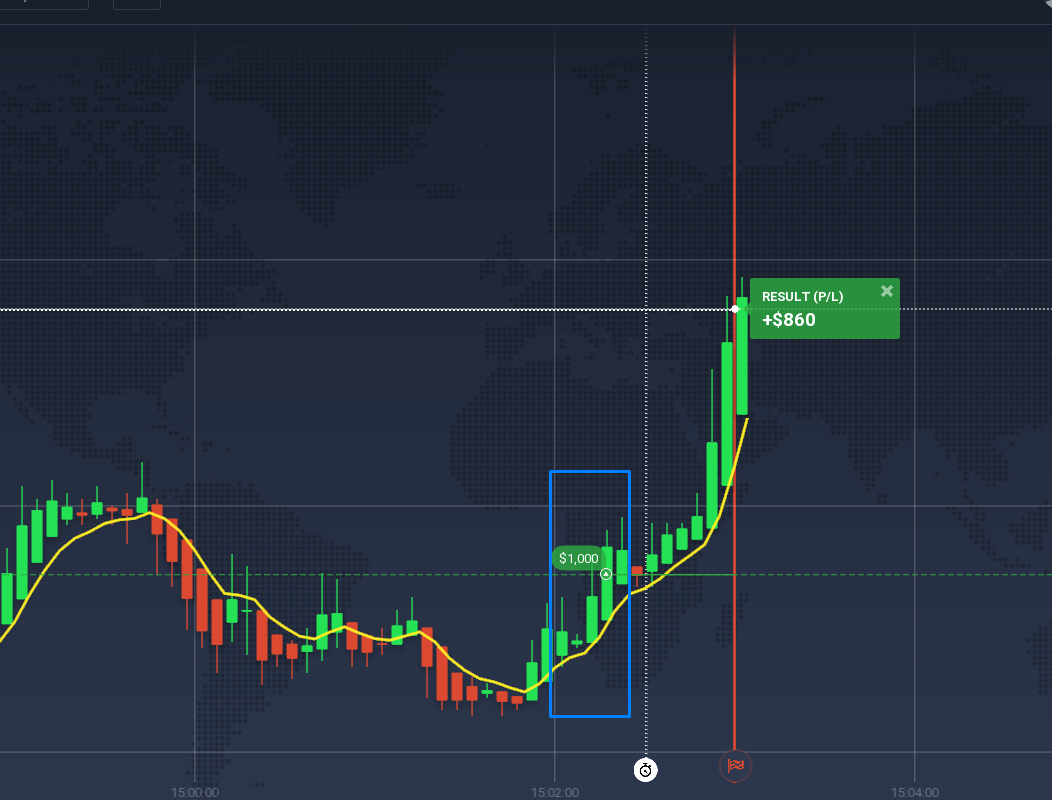
- Set up the EMA indicator with a period of 6.
- Look for the so-called doji candle, which resembles a cross (see screenshot for reference).
- If the next candle closes firmly beyond the EMA, open a trade in the direction of the closed candle. For example, if the candlestick is red, then open a bearish trade. If it’s green, open a bullish trade.
4. Four candles: multi-indicator strategy with higher precision
This strategy uses 3 indicators and works well when the market indicates moderate sideways movement.
Indicator settings:
- SMA with a period of 3
- MACD (default settings of 12, 26, 9)
- Stochastic (with values D = 3, K = 5)
How to use:
- Look for three consecutive candles of the same color, either green or red.
- Ensure that the SMA aligns with the candle direction.
- Check if Stochastic is nearing or in the overbought zone (top for three green candles) or oversold zone (bottom for three red candles).
- Observe if MACD trends down toward the zero line (for red candles) or up (for green candles).
- Enter the market at the close of the third candle.
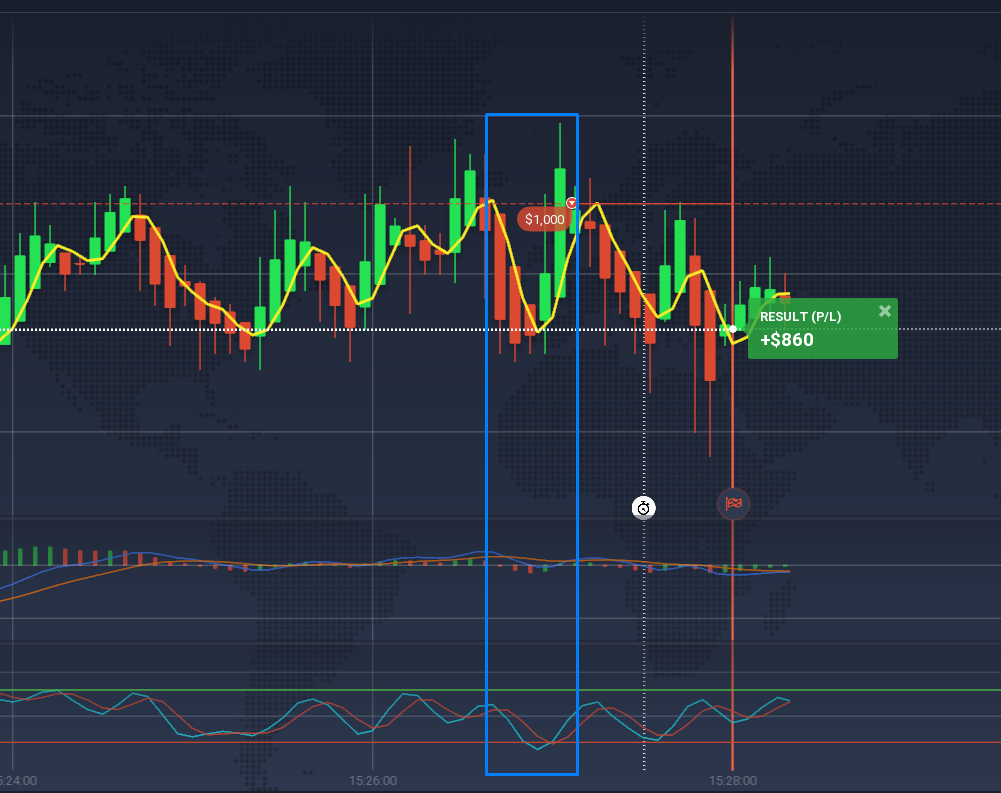
On the screenshot, we see three consecutive red candles that align with the yellow SMA line. The middle MACD indicator trends down toward the zero line, and the Stochastic is in the oversold zone, breaking through the bottom red line. Altogether, these serve as a signal to open a bearish trade.
5. Martingale: the ultimate risk management strategy for BO
Last but not least — Martingale, one of the best binary options strategies widely used by the trading community.
The Martingale strategy is like a backup plan for binary options traders. When you lose a trade, instead of giving up, you double down on your next bet. The idea is to keep doubling until you win, making up for your losses and scoring some profit.
Example:
Let’s say you start with a $10 bullish trade and lose. Next, you double up to $20 with a deal in the same direction. If you lose again, you bet $40, and so on. Repeat until the first winning trade covers all your previous losses.
Martingale is one of the riskiest binary options trading strategies — but also the most efficient. If you hit a losing streak, those bets add up fast, and you could lose big. So, use Martingale wisely and always keep an eye on your risk.
Conclusion
Choosing the best binary options strategies is a matter of time and practice. The strategies we’ve covered above are the easiest and most straightforward, perfect for newbies.
Explore these binary options strategies on IQ Option and drop a comment sharing which one scored you the most profitable deals!

