
Support and resistance levels are critical technical indicators forming the basis of a wide range of technical analysis tools. Traders determine support and resistance in price action to identify the ideal price points to buy and sell securities.
Looking to make informed trading decisions, rather than impulsive, emotion-driven choices?
Support and resistance are the most essential indicators of technical trading, helping you eliminate most of the guesswork and identify potential trading opportunities.
What Are Support and Resistance?
Support and resistance are key levels on a price chart where buying and selling pressure is in equilibrium, causing the price to either bounce off the level or break through it. These are horizontal price levels commonly established by connecting the highs of price bars to other highs or lows to lows.
☝️
Support is a level on the trading chart beyond which an asset’s price will not decline or fall, and bounces back up. It acts as a floor that limits any further downward movement. At this point, buyers are more likely to purchase an asset, and sellers are hesitant to sell, leading to an increase in demand and consequently driving up the asset’s price.
Conversely, resistance is a level where price finds it hard to break through to the upside, and is pushed back down. Resistance is a price point where the asset has high supply and lower demand, decreasing the asset’s price and preventing further price increases. It acts as a ceiling, limiting further upward price movement.
How to Determine Support and Resistance Levels
To eliminate some of the uncertainty that comes with trading, traders must always consider an asset’s support and resistance levels before they enter a trade.
Trend Lines
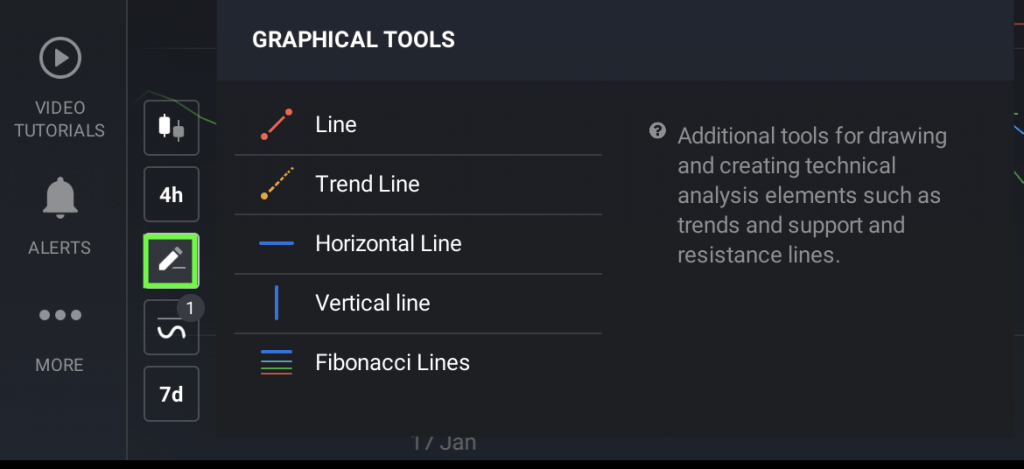
A trader must first Identify key support and resistance levels with the use of several technical indicators. The most common way to identify support and resistance is through price action, by looking for highs and lows within specific periods. These levels could be recent swing highs or lows or significant price points such as round numbers or psychological levels. Traders use the graphical line tool to connect the highs and the lows and draw the lines accordingly.

Trend lines is another graphical tool that can be used. These lines connect two or more price points on a chart, making it quite easy to use. In an uptrend, the trendline acts as a support level, while in a downtrend, the trendline acts as a resistance level.
Moving Average
Another way is using moving averages including 10-day, 20-day, 50-day, 100-day, or 200-day moving averages to identify support and resistance levels. The moving average can act as a support level when the price is above it; conversely, the moving average can act as a resistance level when the price is below it.


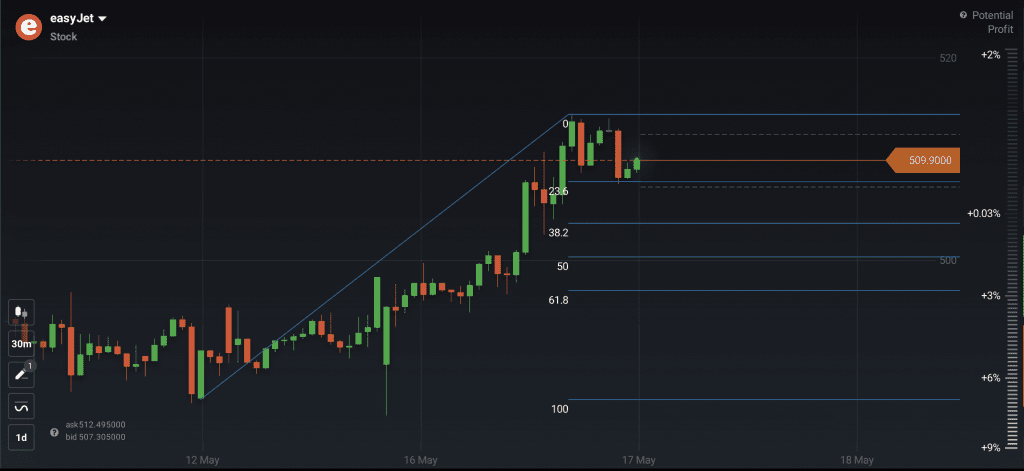
Fibonacci Retracement as Support and Resistance
Fibonacci retracement is another technical analysis tool used to identify potential support and resistance levels. It is based on the Fibonacci sequence, introduced by the Italian mathematician Leonardo Fibonacci. The Fibonacci sequence is a series of numbers in which each number is the sum of the two preceding numbers, starting with 0 and 1. These levels are drawn using horizontal lines to mark the percentage retracement levels between a market’s high and low points.
The Fibonacci retracement levels are used to determine potential support or resistance levels. This can help identify key areas where traders might enter or exit positions, as well as potential stop-loss levels to manage risk. Read more about how to use the Fibonacci lines to get entry and exit signals in this article: Applying Fibonacci Lines in Trading.
Ichimoku Cloud
The Ichimoku Cloud, also known as Ichimoku Kinko Hyo, is a technical analysis tool used to reveal the overall strength and direction of the trend. Ichimoku helps to identify potential trend reversals and momentum shifts in the market. The Ichimoku Cloud indicator consists of several elements, including the Conversion Line (Tenkan-sen) (9 periods) and Standard Line (Kijun-sen) (26 periods) that act as dynamic support and resistance lines. While this indicator may look a bit complicated, it is not hard to grasp, and it can prove to be extremely useful. To learn how to use it for determining support and resistance lines, as well as finding entry and exit points, read this article: Ichimoku Cloud Indicator Strategy — One Indicator for Any Occasion.

Traders often use Ichimoku support and resistance levels in combination with other technical indicators such as Relative Strength Index (RSI), Moving Average Convergence Divergence (MACD), and Bollinger Bands to further confirm the received signals and improve the accuracy of their trades.
Support Resistance Price Action
Once the support and resistance levels are confirmed, traders must analyze the price action around these levels.
☝️
- To enter a long position (“Buy”), a trader can open a trade just above the support level after a bounce. To minimize potential losses in case of a reversal to a downward trend, a trader can set a stop-loss order just below the support level when placing a buy order.
- In short selling (“Sell”), a trader needs to pay attention to the resistance level. Short positions can be entered just below resistance levels, with the expectation of price decrease. The stop-loss can be set just above the resistance level.
IQ Option Support and Resistance
IQ Option is an online trading platform offering multiple financial instruments, including Forex, stocks, commodities, and cryptocurrencies. The platform provides a rich suite of technical analysis tools, including all of the above mentioned options.
IQ Option helps traders identify key price levels where the market is likely to experience buying or selling pressure. It works by plotting horizontal lines on the price chart, indicating levels where the market has previously encountered support or resistance.
The IQ Option platform enables traders to draw their support and resistance levels manually. Traders can use the platform’s drawing tools in the graphical tools feature to mark key price levels on the chart and monitor how the market reacts when prices approach those levels.
With IQ Option support and resistance tools, traders can identify potential trade setups and determine entry and exit points for their trades. These levels can also be used to manage risk by placing stop-loss orders near support or resistance levels.
Final Words
Support and resistance levels are crucial concepts for identifying potential trading opportunities and managing risk. Understanding and applying support and resistance levels can significantly improve a trader’s chances of success.
Don’t hesitate to practice using these indicators in your IQ Option demo account for maximizing your profits.

