Have you ever lost a trade due to missing the perfect entry point or exiting too late? The Commodity Channel Index (CCI) is designed to prevent exactly that, providing traders with actionable insights into market conditions.
Let’s explore how to use the CCI indicator to identify overbought and oversold levels, potential trend reversals, and optimal entry and exit points. We will cover the following topics:
- What’s the CCI indicator?
- How to read the CCI signals
- Examples of use
- How to set up the CCI indicator on the IQ Option platform
What’s the Meaning of the CCI Indicator?
The Commodity Channel Index is a momentum-based oscillator primarily used to identify overbought and oversold conditions in the market and to measure the strength of a price movement.
☝️
Put simply, CCI assists in identifying whether bulls or bears are in control of the market.
No worries about the term “commodity” in the “Commodity Channel Index” by the way. In the 1970s when it originated it was all about commodities, but it’s actually applicable across various markets like forex, stocks, etc. Today, traders rely on the CCI to spot:
- Potential trend reversals
- Divergence
- Potential breakouts
How to Read CCI Signals
Now, let’s get the CCI indicator explained. Its data is based on the difference between the current asset price and the historical average figures. Essentially, what the CCI indicator does is look at how much the current price of an asset differs from its average price over time.
The hypothesis behind this indicator is that prices tend to stay within certain ranges.
☝️
If the CCI line is above 0, it means the price is higher than usual, and if it’s below 0, it’s lower than usual.
So, if the price goes way above or below these ranges, there’s a good chance it’ll come back soon. Traders might open a trade at these times, hoping the price will return to its usual range.
Examples of CCI Indicator Use
Let’s explore practical examples and four types of Commodity Channel Index strategies.
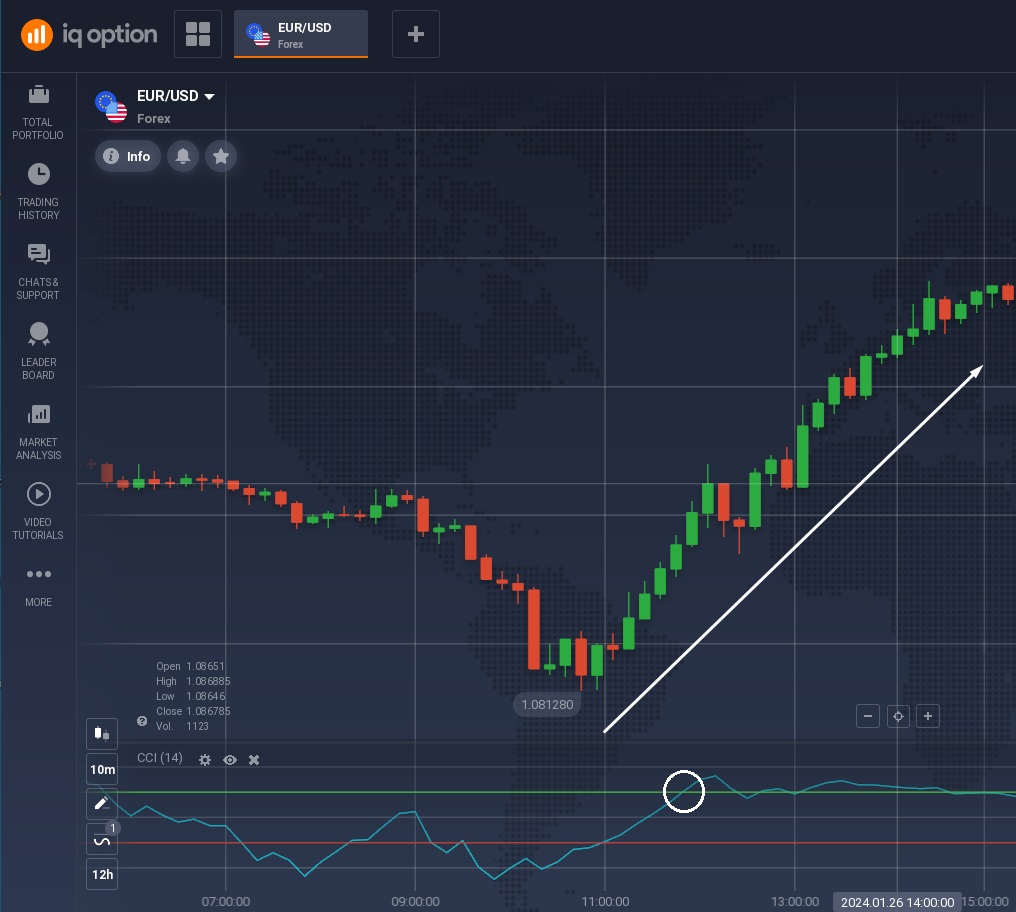
- When the CCI crosses above +100 ☝️, it typically indicates a bullish market, suggesting opening a long position (BUY).
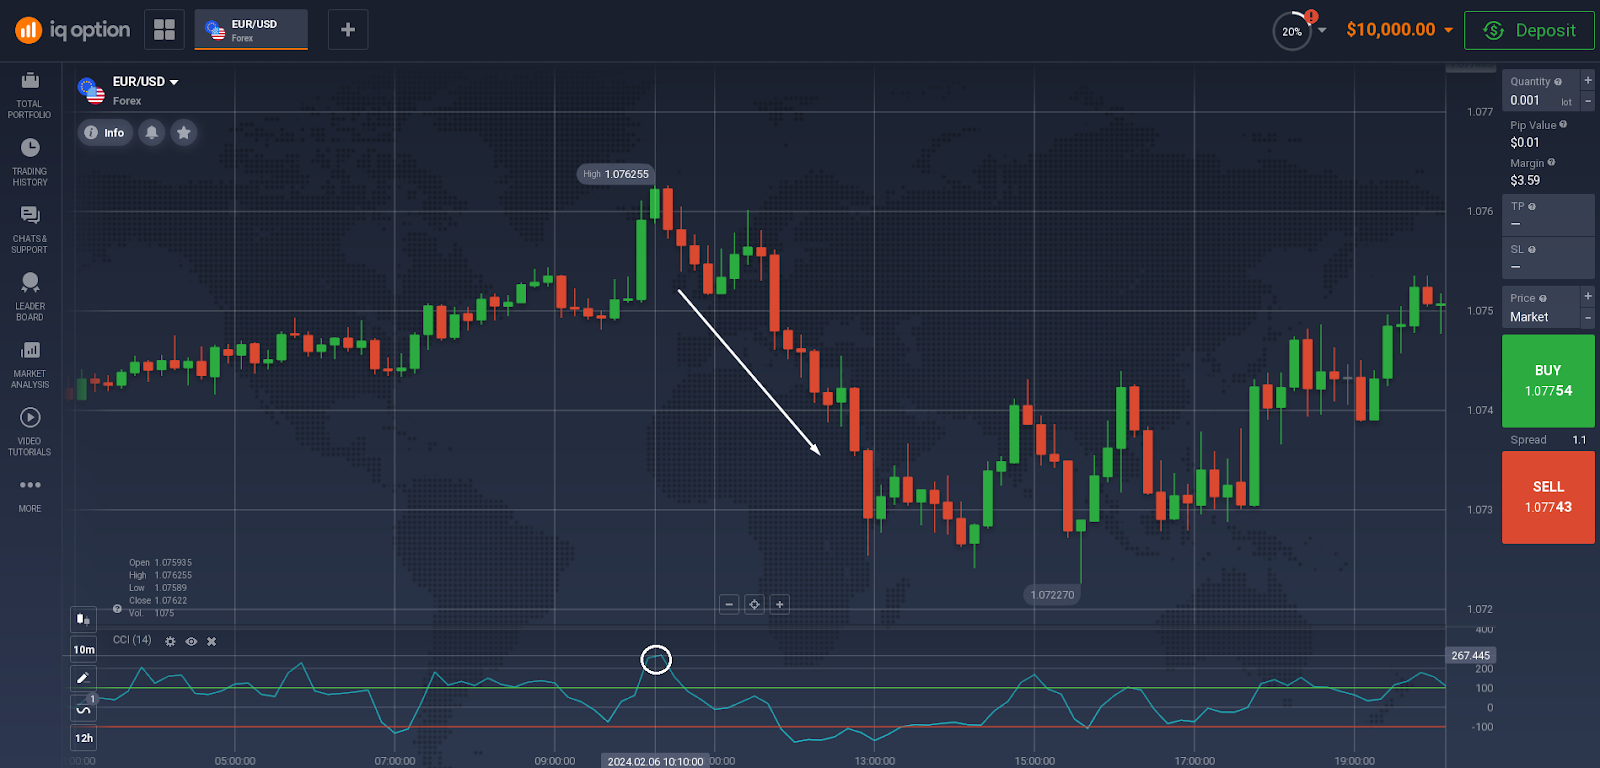
- When the CCI climbs significantly ☝️☝️ and crosses above +150, it may indicate overbought conditions, prompting traders to consider shorting the asset (SELL).

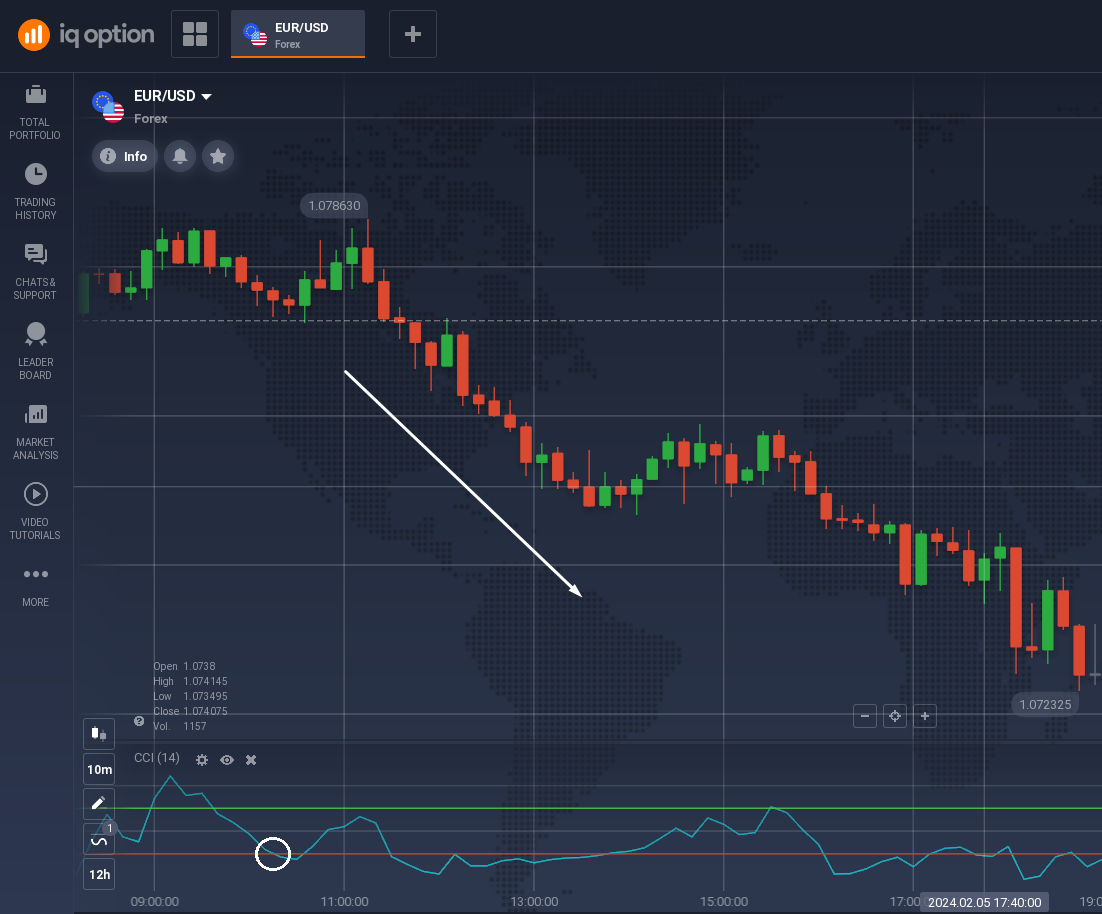
- When the CCI crosses below -100 👇, it may signal the bearish trend and suggest opening a short position (SELL).
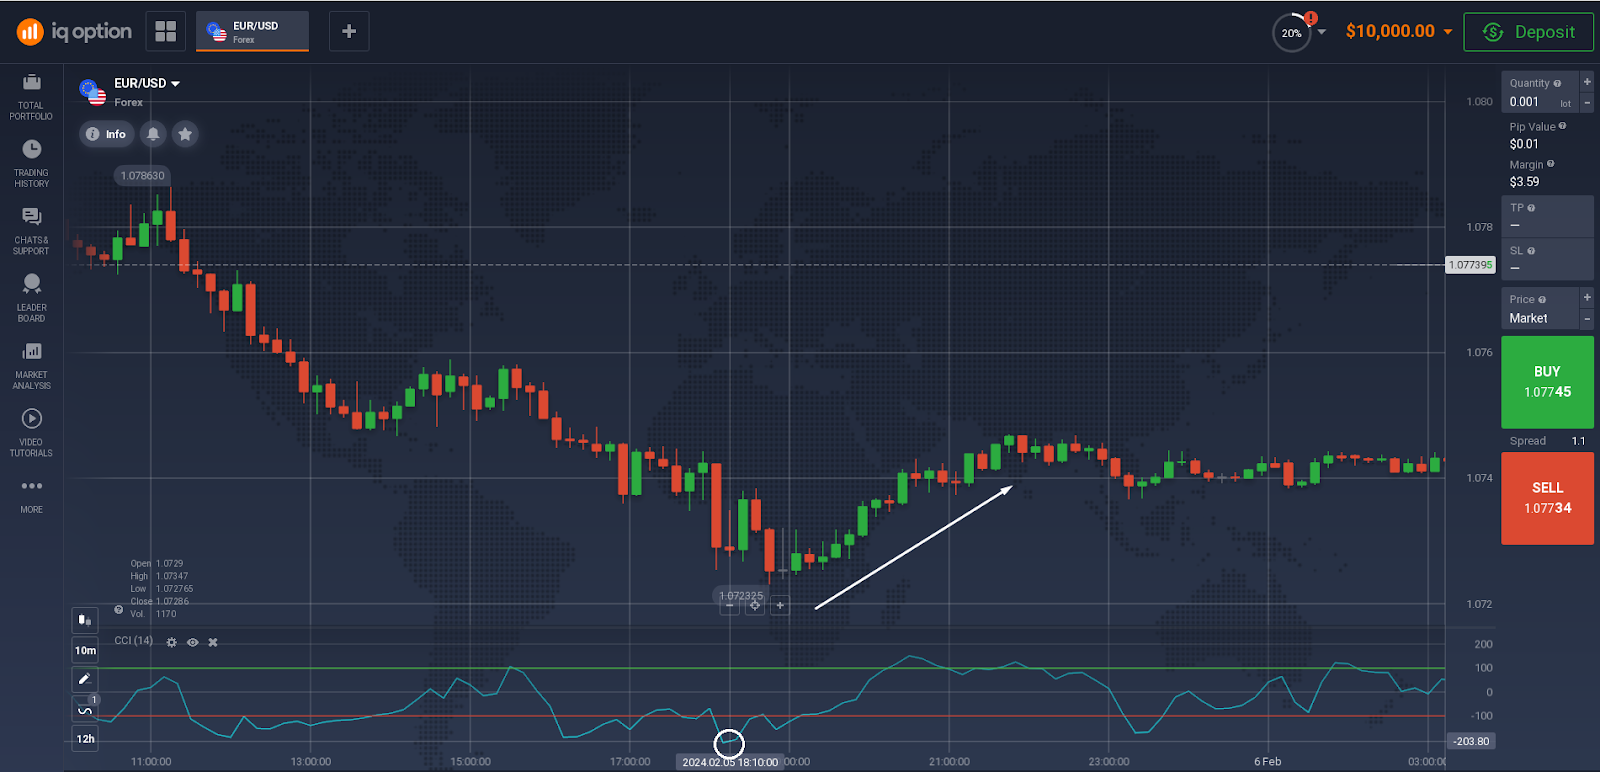
- When the CCI drops well below -200 👇👇, it may signal oversold conditions, prompting traders to seek buying opportunities.
How to Use the CCI Indicator on the IQ Option Platform
Now that you understand how to apply the Commodity Channel Index strategy, you can practice trading with it. Here’s how to find and set up this indicator on the IQ Option platform.
- Log in to the IQ Option trade room or register an account (it’s free).
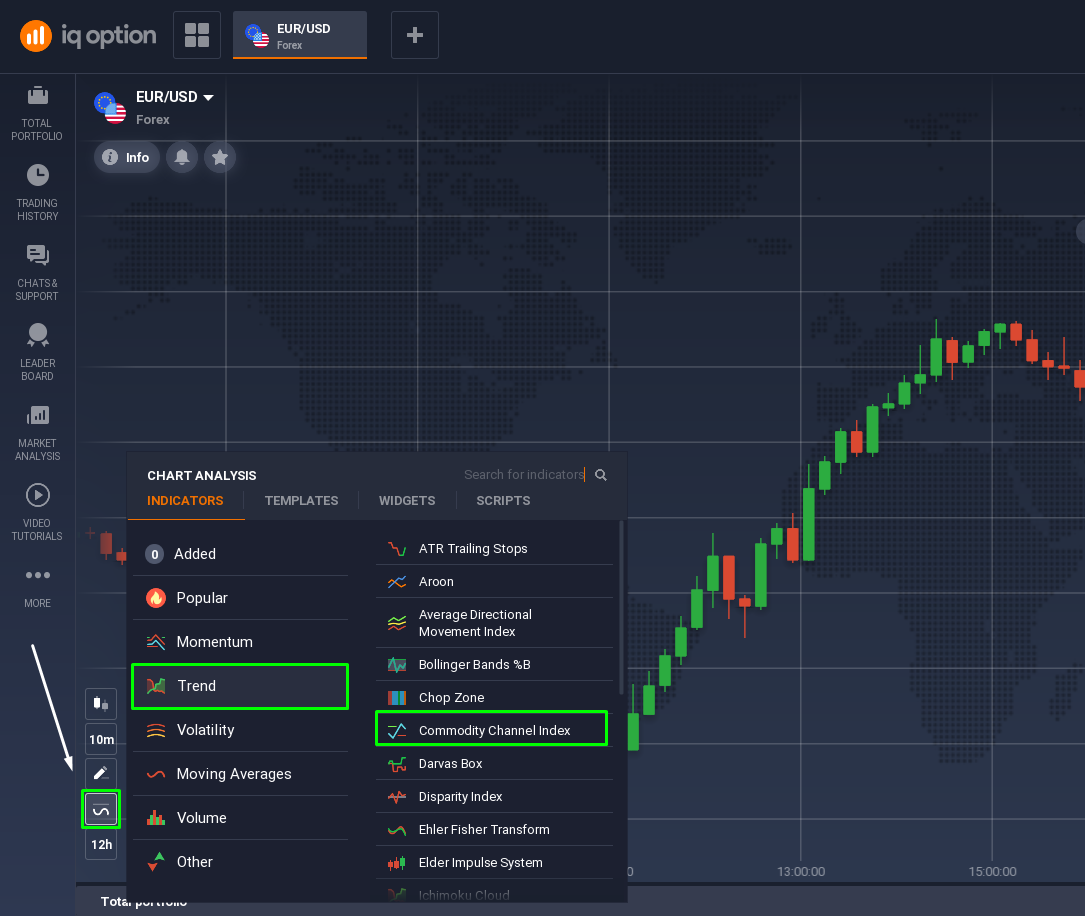
- Click on the Indicators icon located in the bottom left corner of the trade room. You can find it in the Trend group or simply use the search box.
- In most cases, you can stick with IQ Option’s default parameters: a period of 14 and an overbought level of 100. However, feel free to adjust the parameters to align with your specific asset and CCI indicator strategy.

- If you’re using a multi-indicator strategy, consider adjusting the colors of your CCI to avoid confusion. You can also increase the thickness of the lines to make them more prominent on the chart.
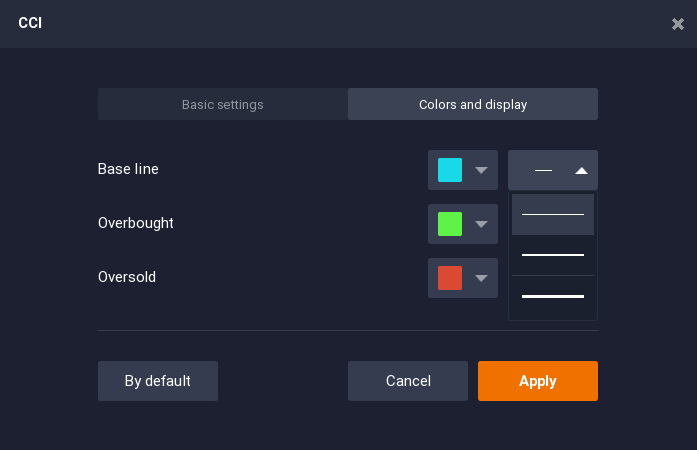
- Press Apply, and you’re all set to trade with the CCI indicator!
Conclusion
The CCI indicator, with its ability to show overbought and oversold conditions, helps traders read the chart with higher precision, improve their timing, minimize risks, and potentially increase their profits. It’s super easy to apply and interpret — just watch when it crosses the +100 and -100 levels — which is why it’s a popular tool in any trader’s starter kit.

