
Swing trading is a popular trading strategy used in various financial markets, including stocks, forex, and commodities. It involves opening a trade at the beginning of a new trend and holding your positions for a few days to a few months to benefit from the anticipated price move. Swing trading allows you to take advantage of the ups and downs of the market. In this article, we’ll explore the basics of swing trading for beginners and provide you with the best swing trading indicators to help you profit from lucrative opportunities in the market.
So, let’s delve in to understand what swing trading is and answer the burning question: “What are the best swing trading indicators?”
What Is Swing Trading?
Swing trading is a trading strategy that involves opening trades and holding them for several days or even months (but usually not longer than a couple months) to profit from the anticipated price movements. It’s based on identifying momentum and the possible reversal points when an asset enters the overbought or oversold areas to capture gains in an asset.
☝️
Swing trading differs from day trading (intraday) when positions are held for a few hours and must be closed by the end of the day. It can be attractive for beginners, since it doesn’t require intense real-time technical analysis. Swing traders have more time to analyze the market and plan their trades, but they are not required to constantly monitor the market, unlike day traders.
Swing trading can be highly profitable if you know how to profit from expected price swings and manage risk. Using swing trading indicators will help you predict when prices might swing upwards or downwards to enter and exit trades at the most opportune times.
Best Swing Trading Indicators
Swing trading indicators help traders gain insights into the current state of the market, identify trading opportunities, and determine the best entry and exit points.
Traders use swing trading indicators on a daily chart or with any other time frame to spot market trends, trend reversals, and potential price movements. The indicators help them identify assets in overbought or oversold conditions and make informed decisions about when to buy and sell them.
Let’s explore the best tried-and-true swing trading indicators for successful trading.
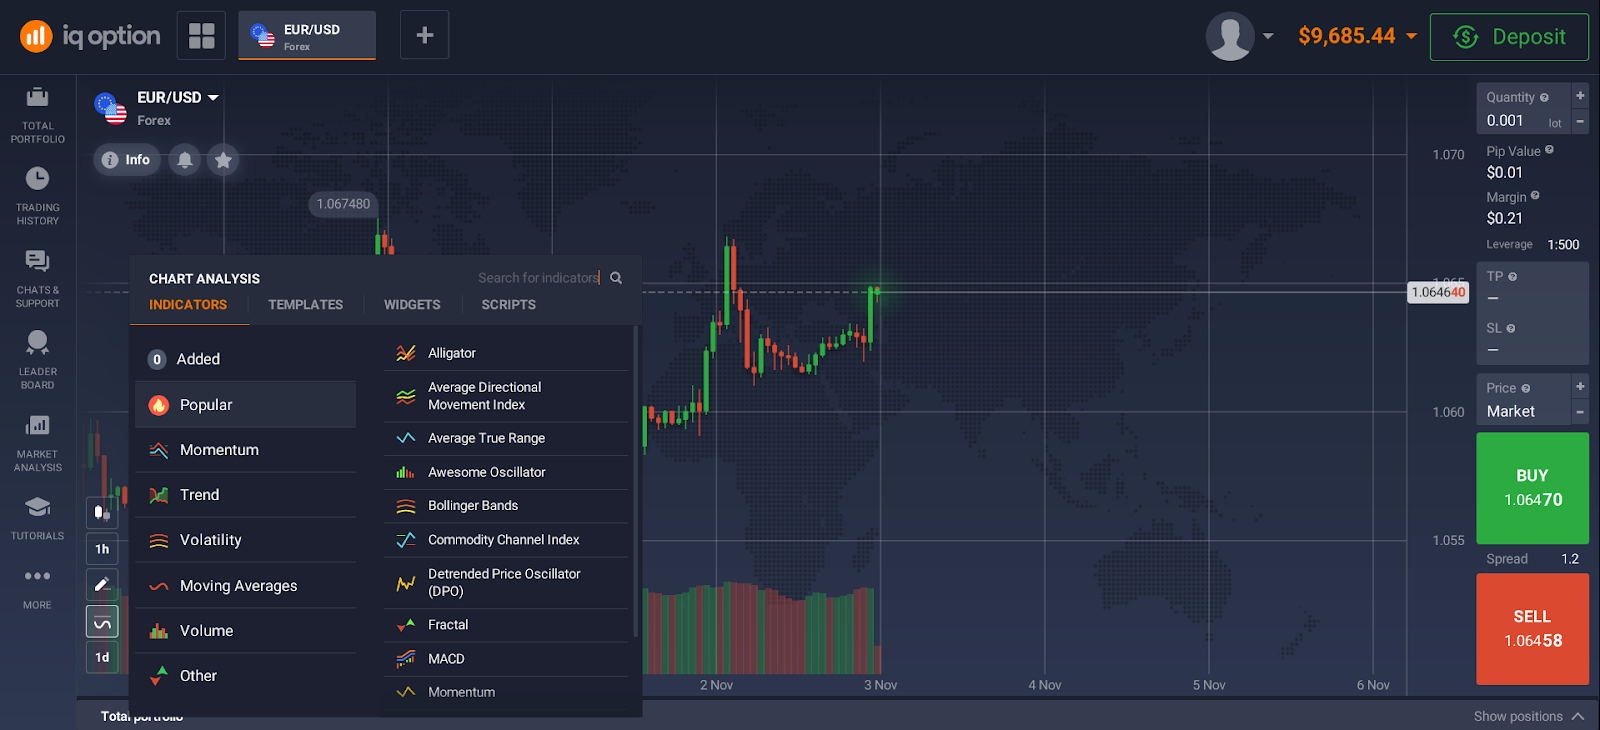
How to Set Up Indicators on IQ Option
All the indicators mentioned are included in the IQ Option traderoom. Here’s how you can activate them.
- Log into your account and navigate to the traderoom.
- Click “Indicators” in the down left menu.
- Find the one you need and click on it to add it to the chart.
If you wish to download the IQ Option app, click here.
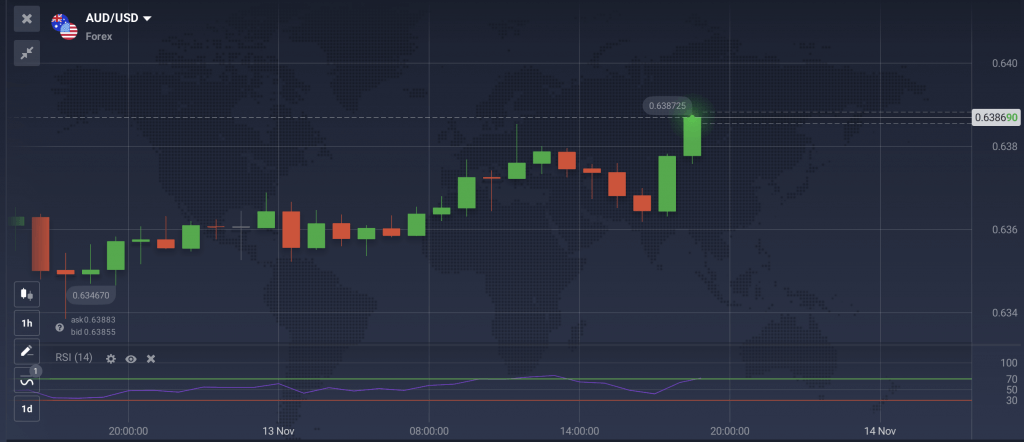
1. Relative Strength Index (RSI)
Relative Strength Index (RSI) is a popular momentum indicator in swing trading. It helps traders determine overbought or oversold conditions, potential trend reversals, and potential buying or selling opportunities.
The RSI indicator is represented as an oscillator, a line graph that moves between 0 and 100.
If the RSI indicator is above 70, the market is considered “overbought,” and the odds of a downward reverse may be high. This means a sell signal is generated, and traders may consider selling or shorting the security.
Conversely, if the RSI values below 30, the market is considered “oversold,” suggesting a potential reversal and an opportunity to buy or go long.
Identifying these corrections ahead of time can help traders make informed trading decisions and increase their gains.
2. Moving Averages (MAs)
No list of indicators would be complete without one of the most popular and universal indicators out there. Moving averages (MA) are among the most efficient trend indicators that help swing traders identify the trend direction and strength. MAs are used to calculate the average price movement of assets over a given period. They can help swing traders filter out short-term noise to identify the underlying trend and potential entry and exit points.

MAs are lagging indicators based on past price changes. It’s, therefore, helpful to use them to confirm rather than predict a trend.
For example, if a security’s price is consistently above its MA, it could signal a buying opportunity. On the other hand, if a security’s price is consistently below its MA, it could signal a selling opportunity.
Another signal to look out for is the Moving Average crossover. When the price chart crosses the MA line upward, it may be signaling a bullish trend. Conversely, a downward crossover may signal a bearish opportunity. A crossover indicates a change in momentum, helping you identify when to get in and out of a trade. Traders can use these crossovers to identify when a trend might be emerging or ending. They can further use them as entry or exit points for their swing trades.
MAs are categorized as short, medium, or long-term, depending on how many periods they monitor. Short-term MAs cover 5-50 lookback periods, while medium-term MAs up to 100, and long-term MAs up to 200 periods. The 50-day and 200-day moving averages are often used by swing traders.
3. Moving Average Convergence Divergence (MACD)
The MACD is a momentum oscillator that helps swing traders identify changes in momentum and market trends. It’s based on the relationship between 2 Moving Averages (MAs) of a security’s price. The MACD indicator consists of a MACD line, a signal line, and a histogram. MACD and the signal line generate the trade signal, while the histogram shows the strength of the current market trend.
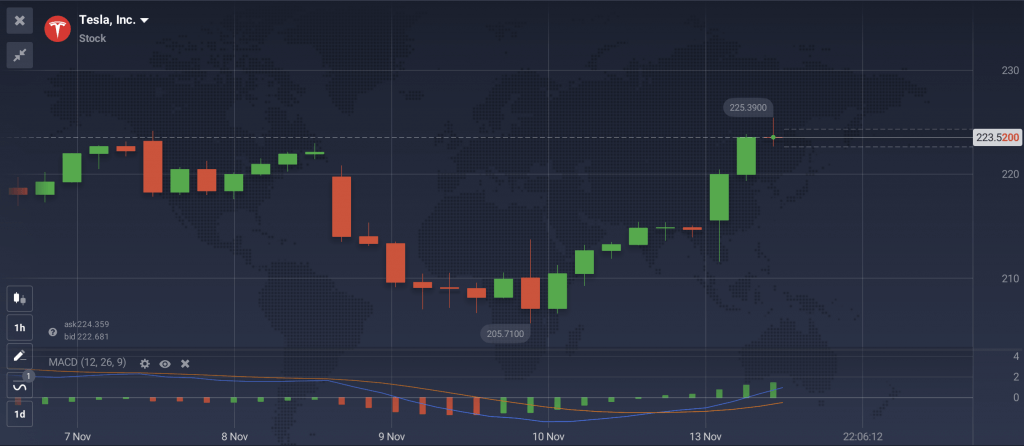
The MACD is calculated by subtracting a period of 26 Exponential Moving Averages (EMAs) from the 12-day EMAs. The signal line is a 9-day EMA of the MACD line.
When the MACD line crosses above the signal line, it’s indicative of an uptrend and a buying opportunity. On the other hand, when the MACD line crosses below the signal line, it indicates a downtrend and a selling signal. However, when the histogram crosses above the zero level, it indicates a much stronger buy signal compared to just the MACD line crossing above the signal line. Conversely, when the histogram crosses below the zero level, it’s indicative of a much stronger sell signal.
To understand how the MACD indicator works and how to read its signals, check out the article: MACD — a Powerful Tool for Technical Analysis.
Swing traders can use MACD to identify trends and trend reversals. However, it’s ineffective for ranging markets and markets prone to sudden price gaps.

4. Bollinger Bands (BB)
Another momentum indicator on the list, Bollinger Bands helps traders quickly identify trends, overbought and oversold levels, and market volatility periods. It consists of a central moving average and two standard deviation bands (positive and negative).
Swing traders can use Bollinger Bands to identify potential entry or exit points for their trades. If a security’s price crosses below the lower Bollinger band, it indicates an oversold condition. The price is likely to reverse direction and rise, and a buy signal is generated. On the other hand, if the price crosses above the upper band, it indicates an overbought condition. The price is likely to reverse and begin to fall, and a sell signal is generated.
The width of the Bollinger Bands, i.e., the gap between the Bands, provides information about the market’s volatility level. When the Bands are wide, it indicates high volatility. On the other hand, the closer the bands are to each other, the lower the volatility.

Bollinger Bands can be combined with other tools to find entry opportunities for swing traders.
5. Stochastic Oscillator
Last but not least, the Stochastic Oscillator is a momentum indicator similar to the RSI. This indicator works for different styles of trading, and can be used both for short-term trading like binary options, and for long-term strategies.
The Stochastic, much like other momentum indicators, presents a range between 0 and 100. When it breaks through the oversold line (20), the trend is likely to reverse, and the price might start growing. In this case, a signal to buy is received. When the oscillator crosses the overbought (80) line, the price is likely to reverse downwards, in which case a signal to sell is registered.
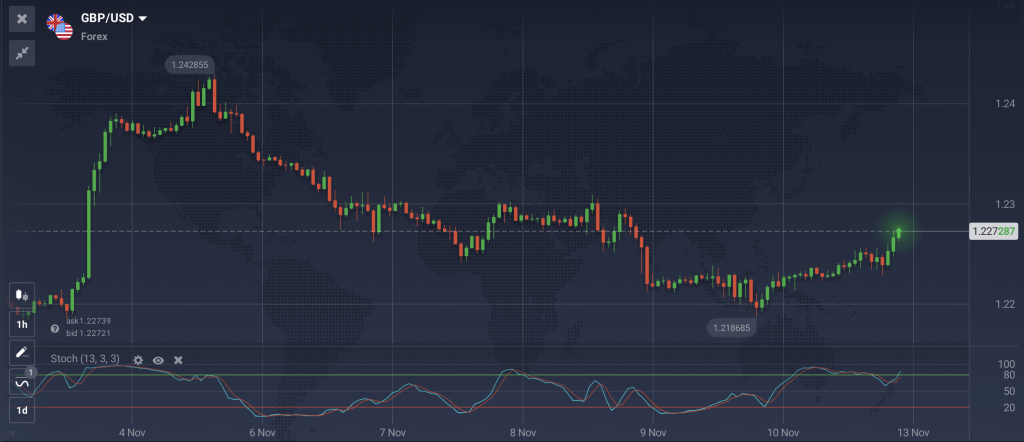
With the Stochastic Oscillator, it is important to watch the crossovers between the two lines of the indicator (%K and %D), as their interaction can help further confirm the trend direction. Additionally, divergences may occur when using this indicator, which is why it might be a good idea to confirm Stochastic’s signals with other indicators as well.
Final Words
Swing trading can be a challenging and risky endeavor, but with the right trading indicators, it can also be a rewarding one. The best swing trading indicators introduced in our article can help you predict market movements and effectively time the market entries. Swing traders can use these indicators to identify overbought and oversold conditions, changes in momentum and trend, and potential buy and sell opportunities.
It’s important to note, however, that there is not one single indicator that can guarantee 100% success. Traders should always make sure to utilize an appropriate risk management strategy, and to combine multiple indicators to confirm signals.

