
Are you looking to navigate the complex financial markets with confidence and get amazing trading results? Timing is everything, especially in volatile markets. This is where the DeMarker indicator comes in, helping you trade in and out of the market based on predictions of future price movements.
The DeMark indicator (DeM), also known as the DeMarker indicator, is a technical analysis tool used to identify potential price changes and measure the market’s demand for a specific asset. This instrument is designed to provide traders with a comprehensive understanding of market trends and potential entry and exit points for any asset, such as binary and digital options, stocks, commodities, and forex pairs.
Read on to learn everything you need to know about the DeMarker indicator and how to use the DeMarker Indicator in trading.
What Is the DeMarker Indicator?
This tool belongs to the oscillator family of technical indicators. Here are the main goals traders can achieve using this indicator.
- Determine the trend’s momentum and direction by comparing the high and low prices in the current period with those of the previous period.
- Assess the demand for the underlying asset.
- Evaluate the risk of buying and selling and choose when to enter the market.
- Seize the opportunity when prices go up or down to execute successful trades.
Traders can generally receive 2 types of signals with this indicator.
- A buying signal when the indicator shows oversold levels.
- A selling signal when it indicates overbought levels.
Trading With the DeMarker Indicator
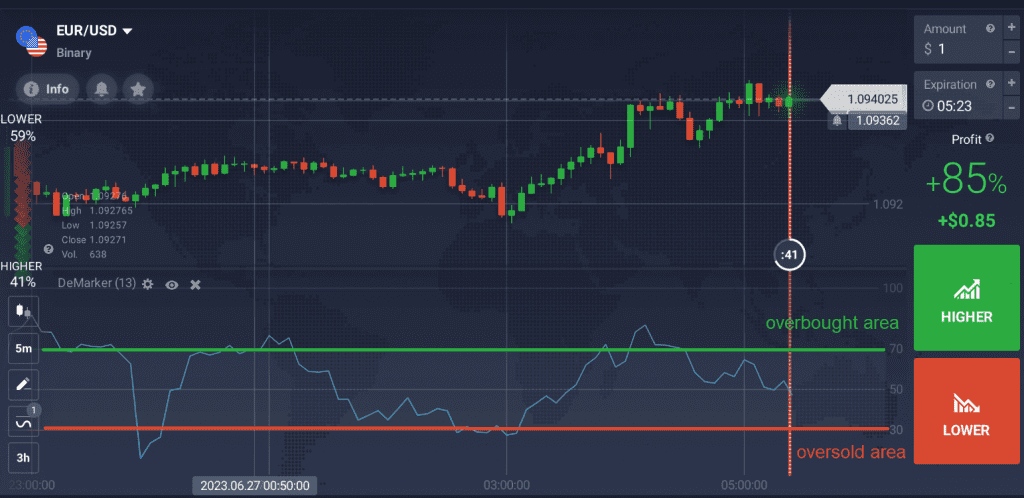
Generally, if the indicator line is trending upward, the market is overbought. If the indicator line is trending down, it signals an oversold state of the market. Once the asset reaches its overbought or oversold level, a price reversal can be expected.
☝️
Buy Signal. -30 levels show that the asset is oversold. The signal to buy appears when the indicator reaches an oversold area of -30 and reverses upwards.
Sell Signal. 70+ levels indicate the asset is extremely overbought. The signal to sell appears when the indicator reaches an overbought area of +70 and reverses downwards.
Below are the two components of the Demarker indicator:
- DeMax – compares the current candle high to the previous candles high.
- DeMin – compares the current candle low to the previous candles low.
How to Use DeMarker Indicator for Trading on IQ Option
IQ Option is an online trading platform offering multiple financial instruments, including binary and digital options, as well as CFDS on forex, stocks, commodities, ETFs, and cryptocurrencies. The platform provides many technical analysis tools, including oscillators like the Relative Strength Index (RSI), the Stochastic indicator, the DeMarker indicator, and more. Follow our step-by-step guide to start trading on IQ Option using DeM.

Step 1. Log in to your account or register to trade on IQ Option using the DeMarker indicator.
Step 2. Click to open the ‘Indicators’ tab.
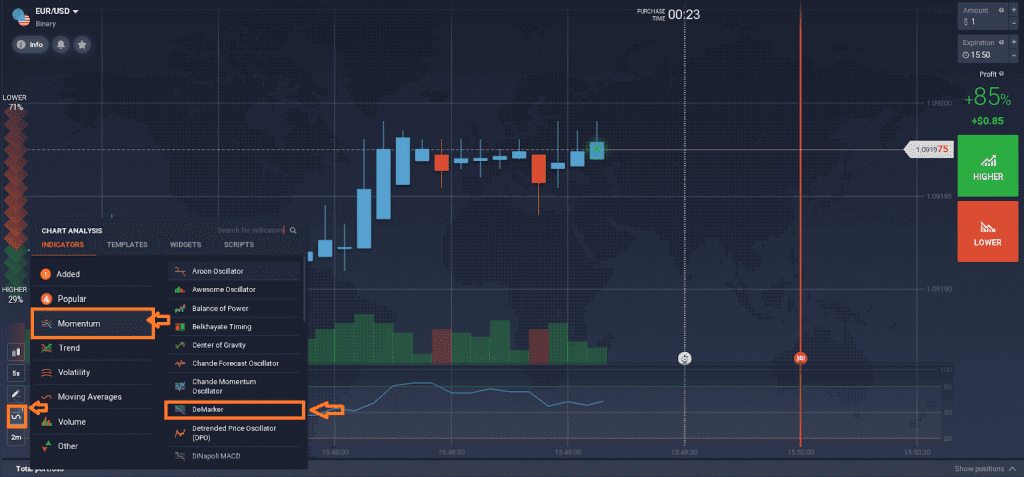
Step 3. Select ‘Momentum’, then click ‘DeMarker’. You can also find a brief description of the indicator by hovering the cursor over its name.
Step 4. Click to view the default DeMarker indicator settings, such as overbought and oversold levels of 80 and 20, and a time frame of 13. These settings are selected to minimize false signals. However, you can modify the DeMarker indicator settings and change the color, width, and style of the main line.
Step 5. Select ‘Apply’ to use the indicator for your selected financial instrument, such as Options, Stocks, Commodities, ETFs, etc.
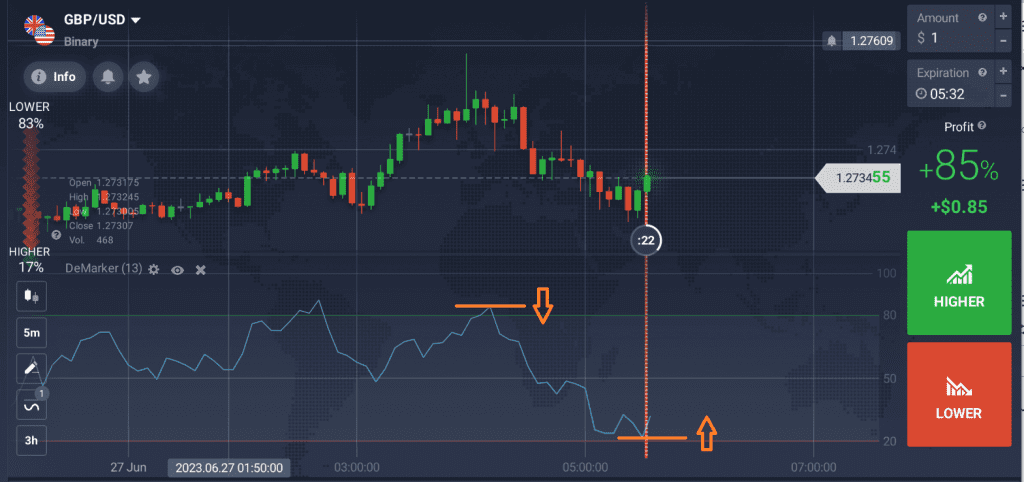
The indicator shows overbought areas when the indicator goes above 80 levels. This is often followed by a trend reversal, where the price starts dropping down.
☝️
Final Words
The DeMarker indicator provides useful information about the market, helping traders identify the directional bias of the market and find an upcoming correction or a reversal on the price chart. While it’s a powerful technical tool for assessing the current market situation and forecasting future prices while managing risk it can sometimes send false signals.
This technical tool is best used in combination with other tools to confirm or refute the signals it generates. You might want to use other technical indicators such as Moving Averages, Average Directional index, the Relative Strength Index (RSI), etc., to double-check the state of the market.
Consider practicing on an IQ Option free demo trading account before committing any real money. Feel free to leave any comments below!

