What would happen, if you combined a great technical indicator and candlestick patterns in your binary options trading? Sounds exciting, doesn’t it? Let’s see what the Keltner Reversal Candlestick Strategy is all about and how you can use it to get impressive trading results in your binary options trading.
How Does It Work?
Keltner Reversal Candlestick Strategy involves applying a technical indicator Keltner Channels along with spotting reversal candlestick patterns. Let’s first take a look at both of these instruments separately to understand how they work.
What is Keltner Channels Indicator?
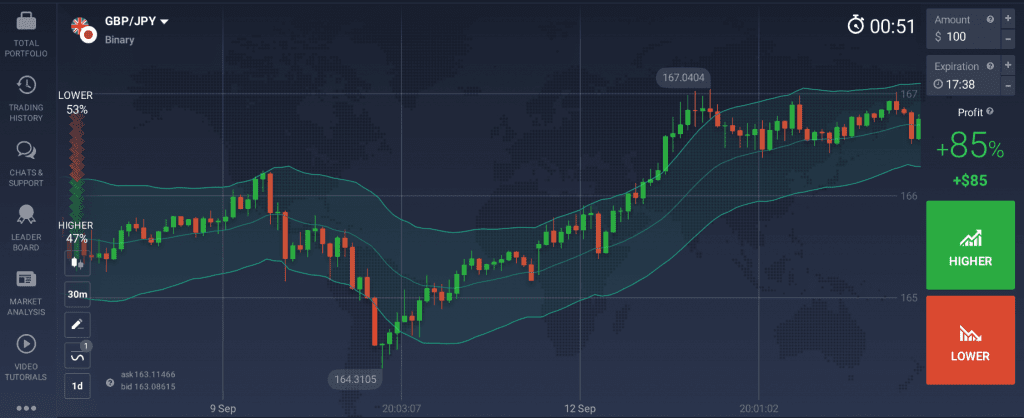
Firstly, you should understand what Keltner Channels indicator is all about. It is an envelope indicator: it has upper and lower bounds that form a channel around the price line. Keltner Channels indicator uses the Exponential Moving Average (EMA) to define the trend direction and the Average True Range (ATR) to set the channel width.
On its own, Keltner Channels can be applied to identify trend reversals and detect breakouts. It may also be helpful in determining oversold and overbought levels. But it can also be used in combination with other technical tools for more precise readings. You can turn to this tool when analyzing different assets, including binary options.
What is a Reversal Candlestick Pattern?
Candlestick patterns are generally formed by several candles pointing to a certain pattern in price fluctuations. In case of a reversal candlestick pattern, it may indicate a possible change in the current trend. They are not 100% accurate – sometimes the trend may continue in the same direction for some time. However, these tools can be quite helpful in providing valuable information about potential trend reversals. Candlestick patterns are usually easy to spot and may help you make trading decisions.


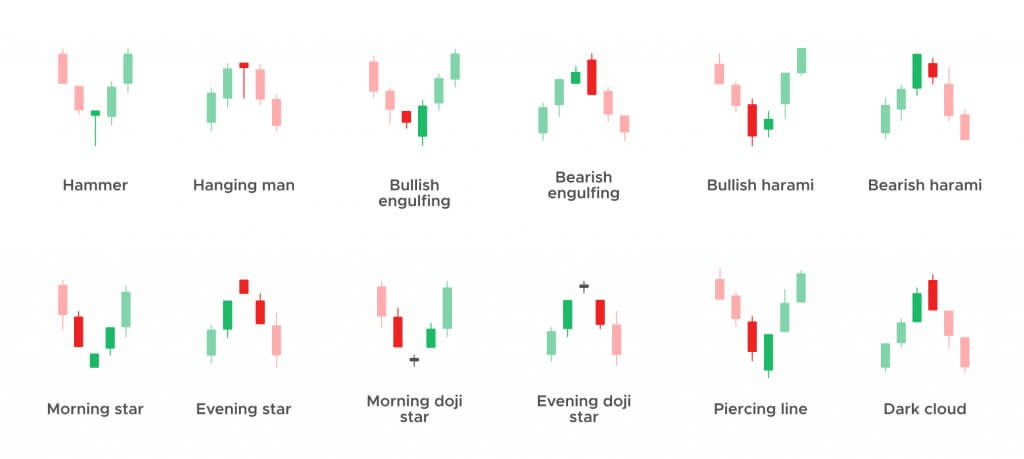
There are many candlestick patterns you can apply in your trading. Most of them point to either bullish or bearish trend reversals. If you observe a bullish candle pattern, it may point to an upcoming change from a downtrend to an uptrend. On reverse, a bearish pattern may indicate an ending uptrend that is about to go downward.
Here are some of the most common reversal candlestick patterns you may find useful for this strategy.
How to Set Up This Strategy?
Here are the basic traderoom settings that you’ll need for the Keltner Reversal Candlestick Strategy to work.
| Binary Options Expiration | 2 to 3 candlesticks |
| Candlestick Timeframe | any |
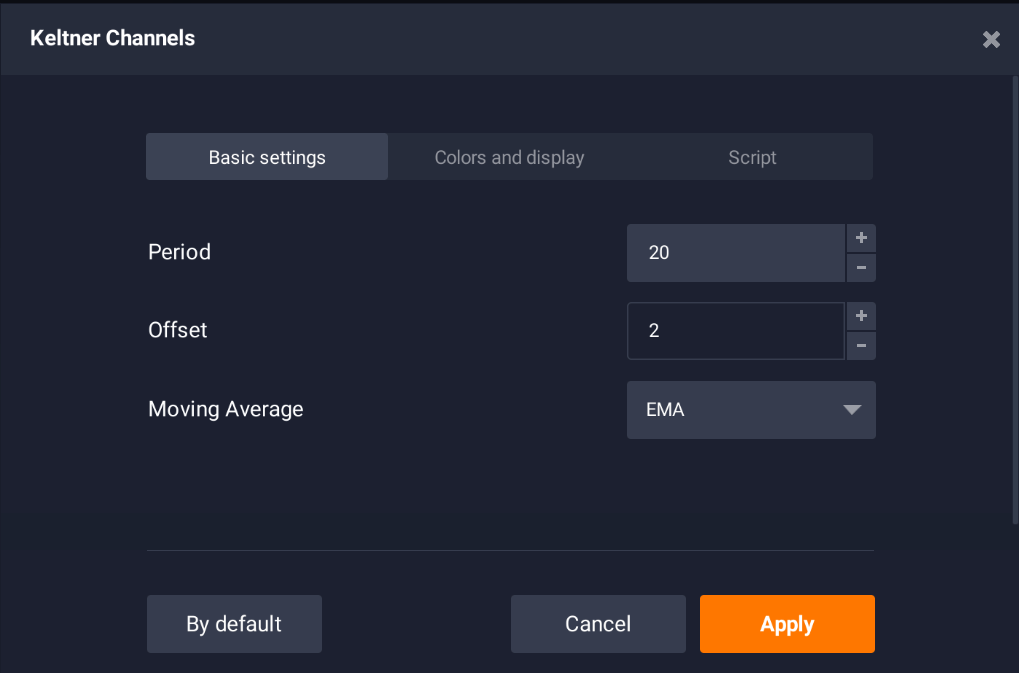
| Keltner Channels | 20 period, 2 offset |
To begin, you should insert the indicated variables in the Keltner Channels settings. To apply this instrument, go to the Indicators section and use the Search feature to locate it.
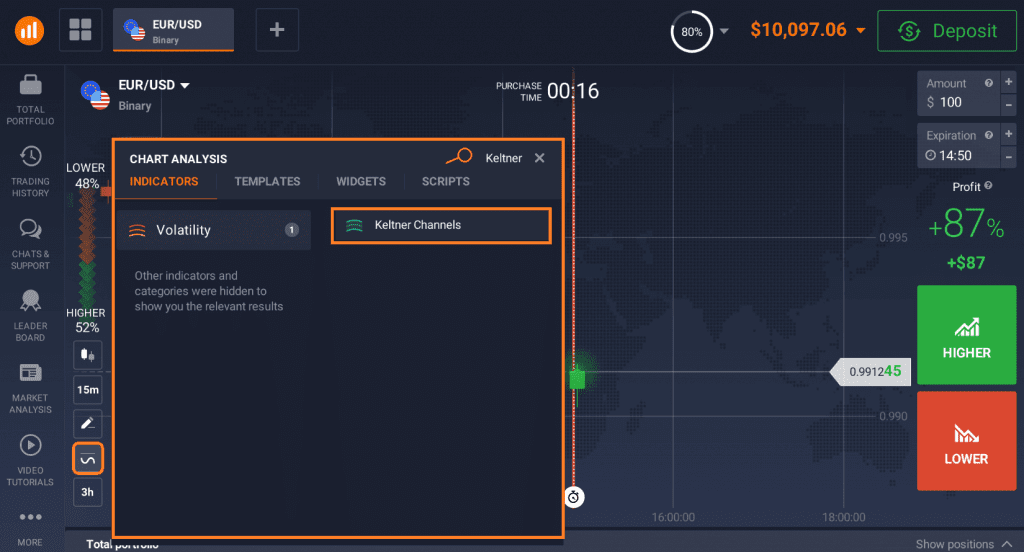
Make sure to set the Period at 20, and the offset at 2 to get the most accurate results. In IQ Option traderoom, you can also play with colors for the indicator’s lines.
Examples of Keltner Reversal Candlestick Strategy
Let’s take a look at some examples of how to use this binary options strategy and catch potential trend reversals. Generally, there are 2 types of signals that you can observe when applying this strategy: Buy and Sell.
Buy
To confirm a possible reversal to an uptrend, you should spot a candlestick that closes below and outside the Keltner Channels. Then look for a bullish reversal candlestick pattern, such as Hammer, Morning star or Harami.
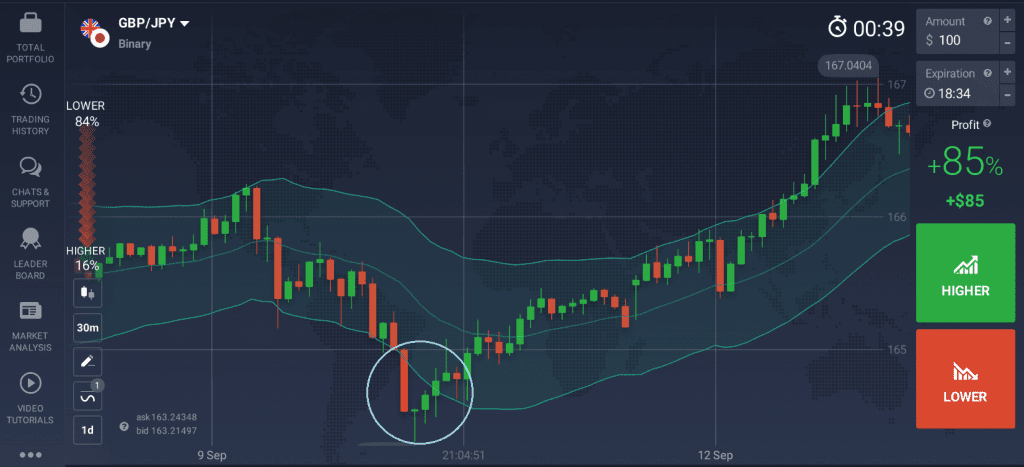
Once you have spotted both of these signs, you may open a long position, expecting the price to go up. However, as with any trading strategy, there are no guarantees that it will work every time. So try to always consider the risks and make decisions based on thorough analysis.
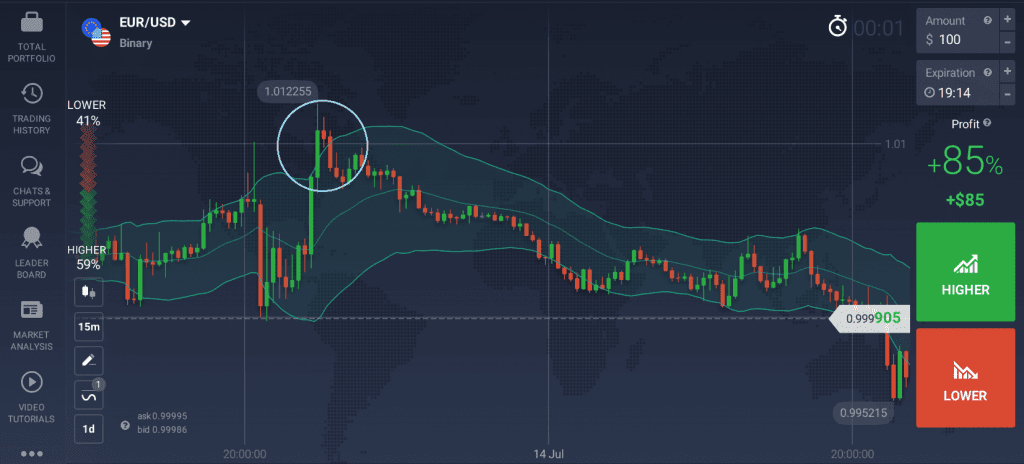
Sell
A Sell signal may be detected when a candlestick closes above and outside the Keltner channels. If it is accompanied by a bearish reversal candlestick pattern, such as Evening star or Engulfing, it may be a sign of an upcoming change to a downtrend. Taking this into account, you may consider opening a short position to benefit from these price movements.
In Conclusion
Keltner Reversal Candlestick Strategy can be a useful tool for binary options trading. To get the most out of this approach, you should learn to apply the Keltner Channels indicator and spot reversal candlestick patterns on price charts. The latter can provide either bullish or bearish signals, which may be used to benefit from price fluctuation in your binary options trading.