The Psychological Line Indicator (PSY) is an oscillator that compares the number of ascending periods to their total number. In other words, it shows the percentage of bars that closed above the previous bar in a given period. Let’s explore how to use the Psychological Line indicator, and what other tools can be used with it.
☝️
Key Features
- The Psychological Line indicator helps traders to identify the direction and the strength of the trend, find overbought and oversold levels, and detect possible reversals.
- This indicator can be used on a chart of any timeframe, from several minutes to several months.
- PSY is effective as a supporting indicator, it is normally combined with other indicators for a more precise analysis. It should not be used alone, as it decreases the accuracy of a prediction.
Psychological Line Indicator Formula
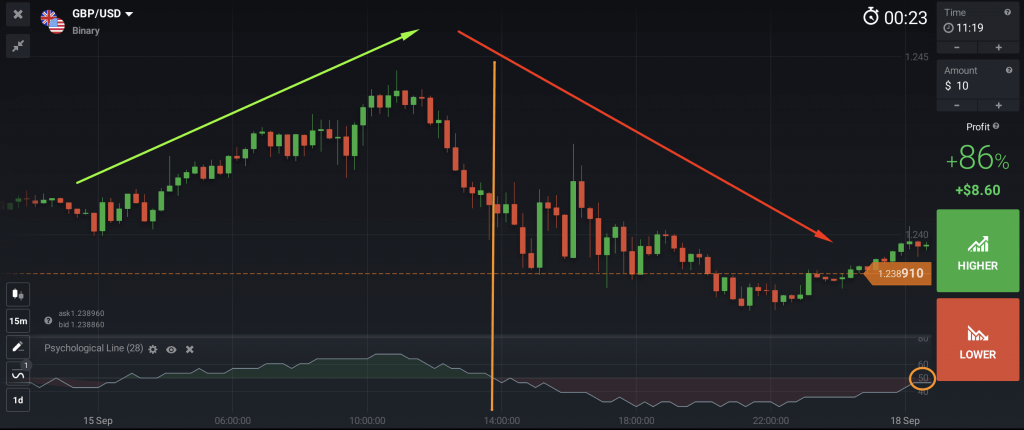
As any oscillator does, the Psychological Line indicator moves between the levels of 0 and 100, where 0 is oversold and 100 — overbought. When the indicator rises above the 50 mark, the market is considered to be bullish, while a fluctuation below 50 might indicate a bearish trend in the market.
The formula used in the calculation of the indicator is the following:
PSY = (Number of Bars Where Closing Price > Previous Closing Price) / Total Number of Bars * 100
Let’s break down this formula to understand it better:
- “Number of Bars Where Closing Price > Previous Closing Price” shows the count of bars/candlesticks in your selected time period where the closing price is higher than the closing price of the preceding bar.
- “Total Number of Bars” is the overall amount of bars/candlesticks considered in the analysis. For example, if you are looking at a daily chart over a 28-day period, the total amount of bars/candlesticks will be 28.
- To express PSY as a percentage, the obtained ratio is multiplied by 100.
How to Use the Psychological Line Indicator
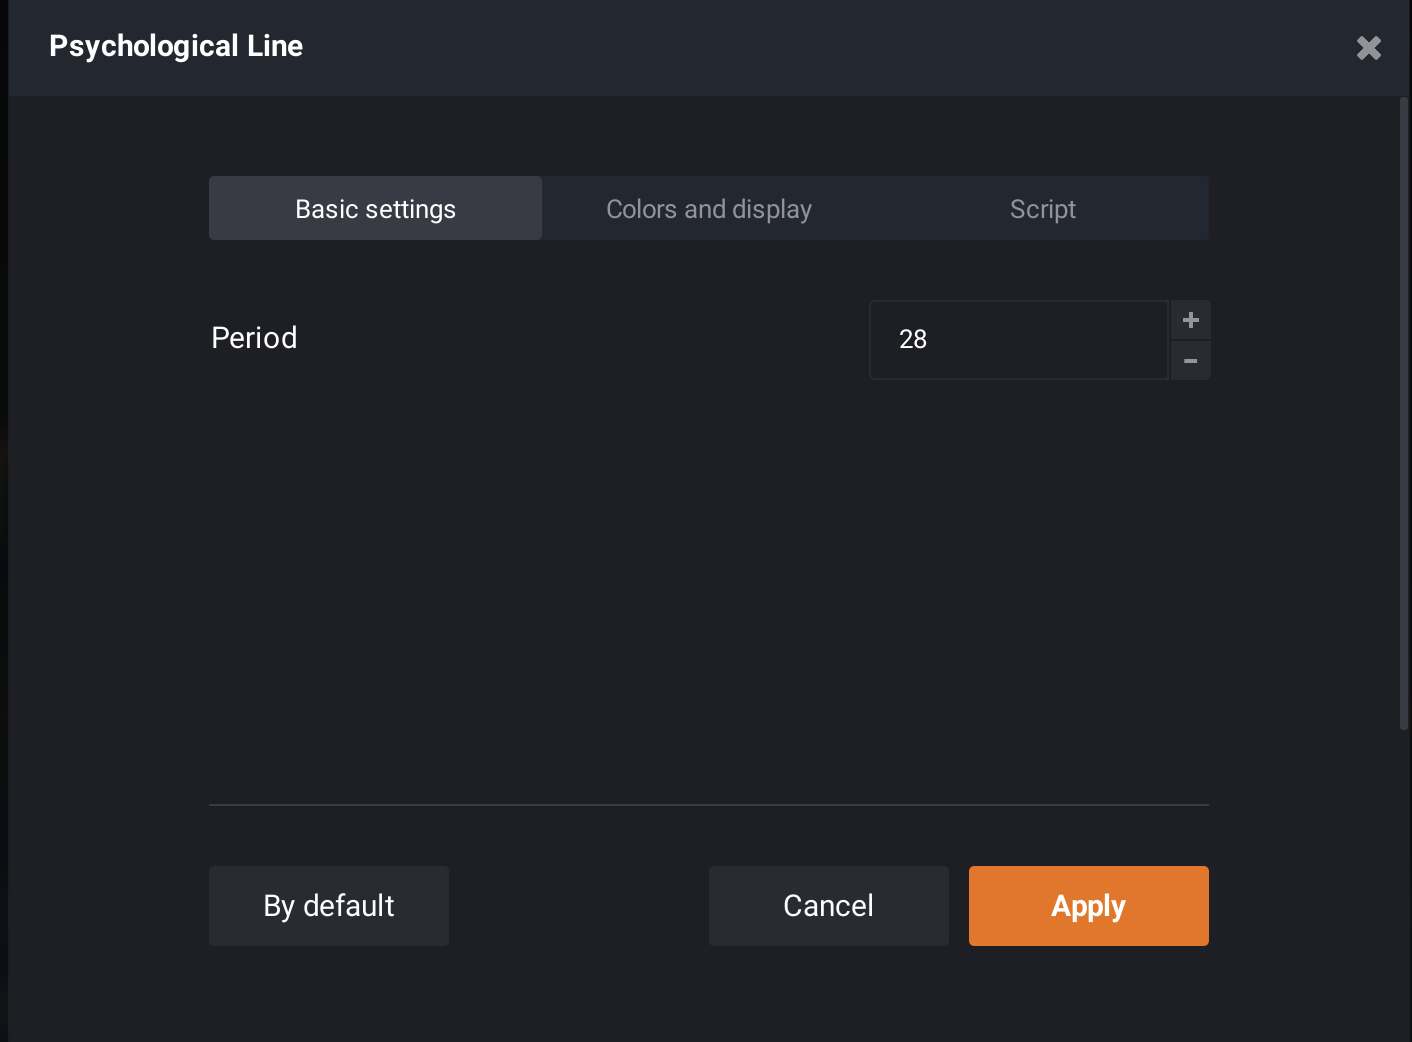
To begin using the Psychological Line indicator, first, you need to set it up in your traderoom. This indicator can be found on the IQ Option platform. To apply it to your chart, choose it in the indicators menu in the “Other” category.

You can customize your experience with this indicator by changing the color of the lines and choosing the period in the settings. You can also click “By default” to use the indicator with the standard setting — 28 periods.
So, how to read this indicator’s signals?
Trading with the trend
You might consider opening a buy position when the Psychological Line moves above the 50-line mark. Conversely, if the oscillator remains in the red zone below the 50-line, you may enter a sell position. The higher the indicator, the stronger the upside trend, and vice versa. The lower the indicator, the stronger the downside trend.
Trading against the trend
Some traders that prefer to trade trend reversals consider the asset overbought when it hits the 70-mark zone, and open a sell position. The 30-mark zone is then considered oversold, and may be a signal to enter a buy position.
Though the PSY generates trading signals, it’s crucial not to rely solely on this tool alone. It should serve as a complementary indicator in your trading arsenal. You can either use it to validate signals from other indicators or employ it as your primary tool in a strategy. However, it’s essential to always seek confirmation for your entry points from alternative sources as well.
Divergence Signals
Another signal the Psychological Line indicator is capable of showing is divergence. A divergence can be detected in a situation where the chart is moving in one direction, while the indicator line is going the opposite direction.
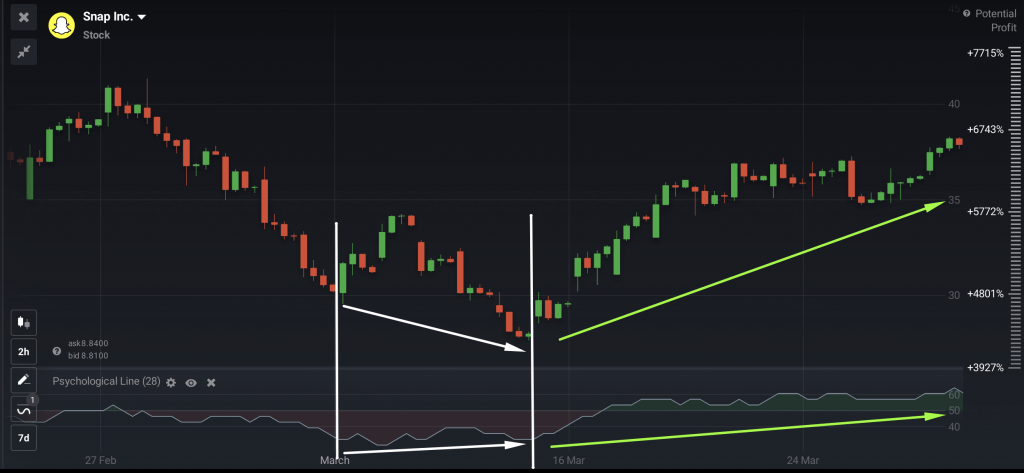
When PSY moves in the opposite direction from the chart, it can often mean that a trend reversal might follow. However, it is advisable to use other indicators in order to confirm the reversal signal.
Conclusion
Now that we have answered the question “what is Psychological Line indicator”, you are ready to apply this oscillator in your trading strategy. If you are wondering what to combine the PSY indicator with, check out our article on the Top-3 Technical Indicators for Beginners.